You can have a detailed analysis and overview of the course's assigned to you. Including progress and how a course evolves over time, average scores, course content consumption, and the success rate.
To access this great new tool:
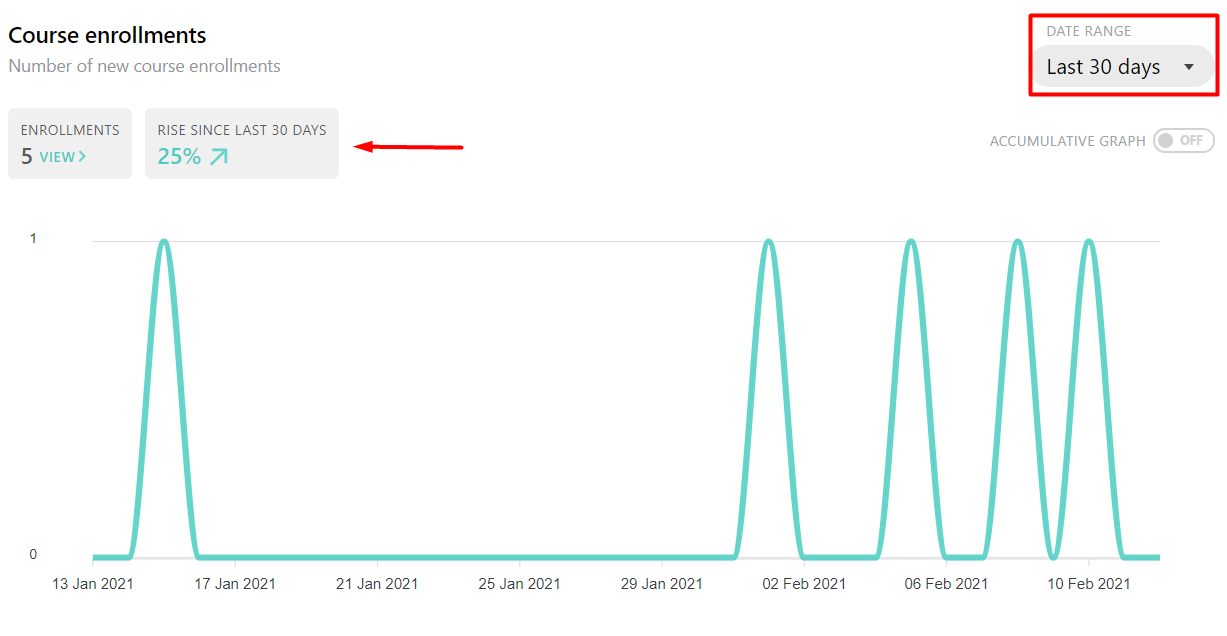
Go to your Teacher Dashboard and open one of your courses. This will show the overall Course Dashboard - but it's not giving you much yet. The trick is to use the "Course Insights" link at the top of the page - identified below with the blue arrow.
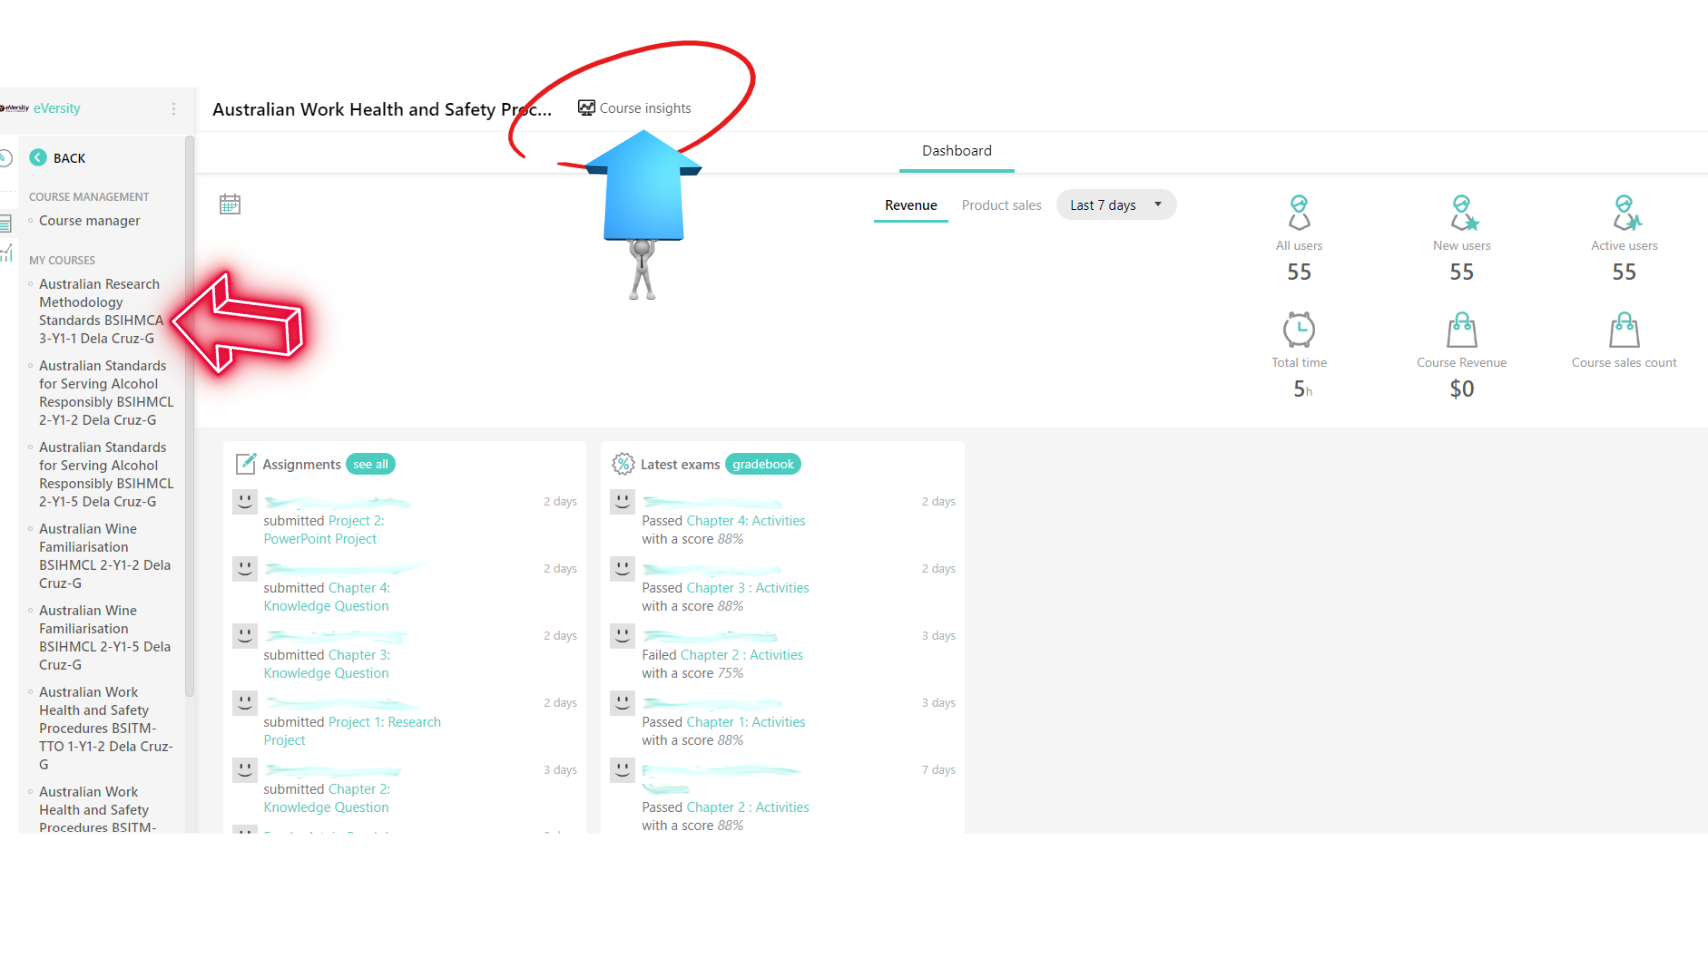
Congratulations - you have just discovered a new world of Student Analysis.
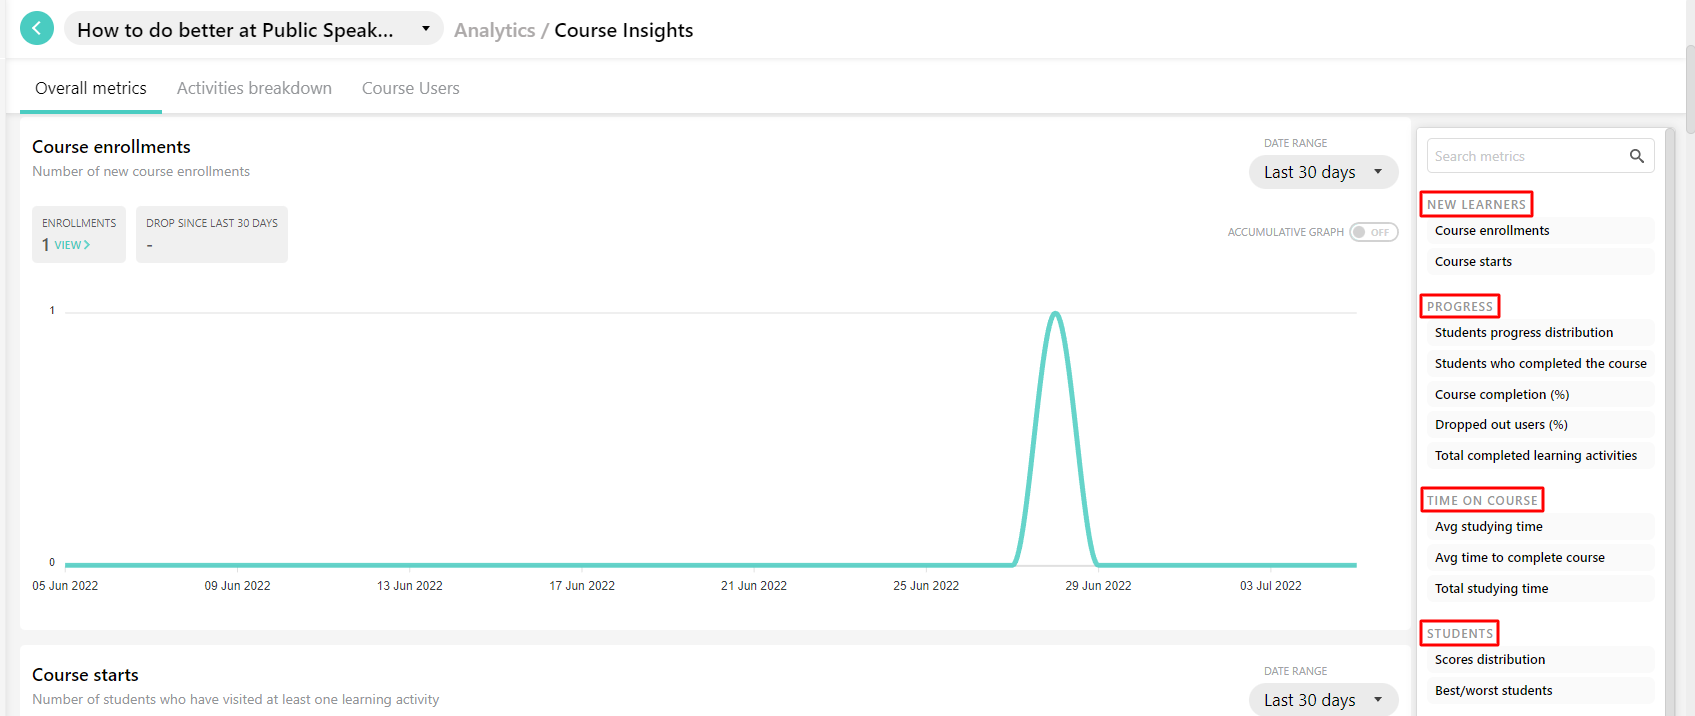
This view gives you an overaching analysis of the course.
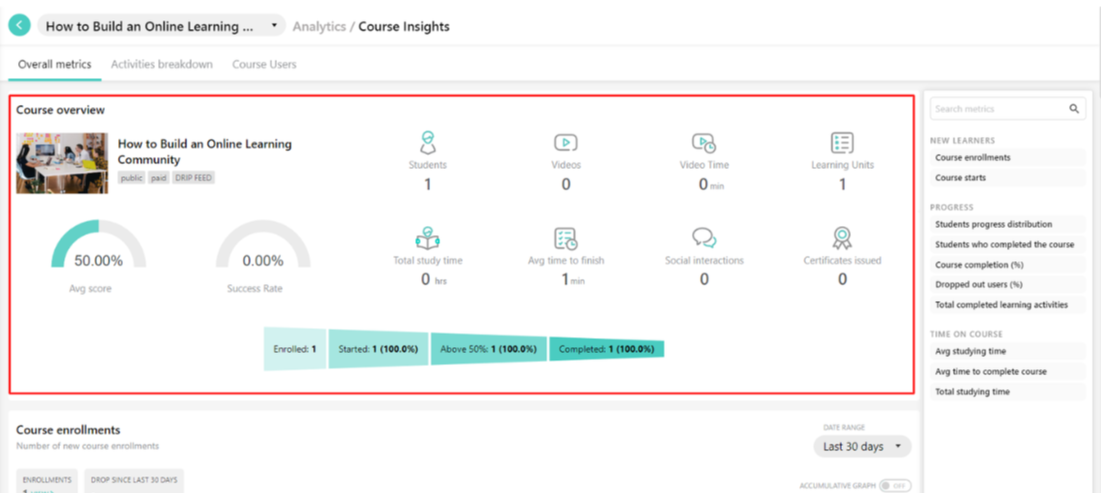
By scrolling down or clicking on the relevant metrics in the right-side menu, you can get a detailed analysis in the form of graphs (in some of the zones you can also switch to an Accumulative graph). The graphs give you an overview of how the respective metrics evolve over time and the distribution of your students' progress and scores. The metrics zones are dynamic and depend on the usage and available learning activities.
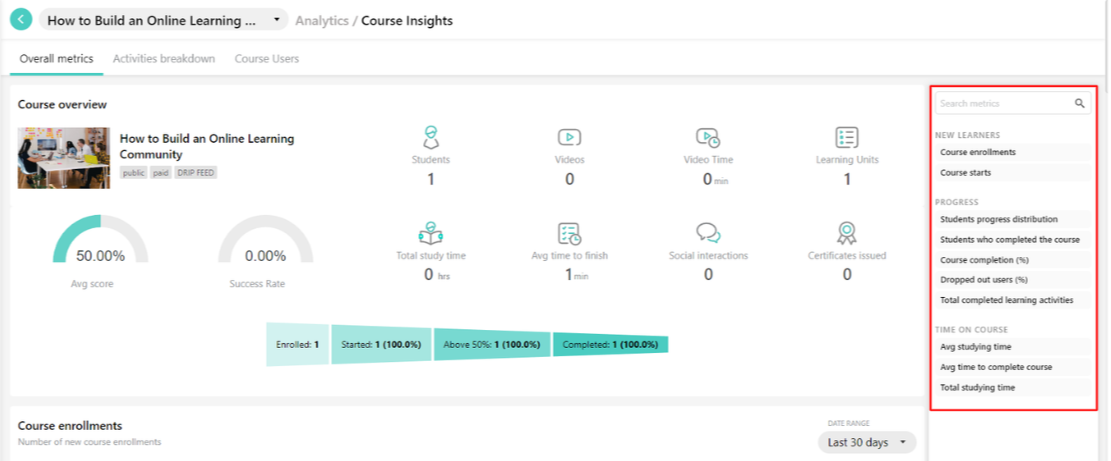
You can filter the results for a specific or custom time range. The metrics zones (except the Student Progress Distribution) give you the ability to compare your results and identify the rise or drop in the date range specified.
The available metrics zones are:
NEW LEARNERS
- Course Enrollments (Number of new course enrollments)
- Course Starts (Number of students who have visited at least one learning activity)
PROGRESS
- Student progress distribution (Student progress in clusters from 0% to 100%)
- Students who completed the course (Number of students who have successfully completed the course)
- Course completion (%) (Percentage of students who have completed the course until the specific date)
- Dropped out users (%) (Percentage of students who have dropped out of the course until the specific date (they were nonactive for 30 days and didn’t complete the course)
- Total completed learning activities (Accumulative number of learning activities completed)
Note: The Dropout rate is defined as dropped out/enrolled students. A user is considered “dropped out” when all the conditions below apply:
- Has been enrolled for over 60 days
- Is inactive for 30 consecutive days
- Has not finished the course
TIME ON COURSE
- Average studying time (Average time spent studying the course)
- Average time to complete a course (Average time that students needed to complete the course successfully)
- Total studying time (Total time over time)
STUDENTS
- Scores distribution (How students answered Student scores in clusters from 0% to 100%)
- Best/worst students (Best and worst learners over time)
SCORES
- Average Score (Average score in the course considering scores in exams, assignments, and certificates)
- Average Exams Score (Average score in exam learning activities)
- Average Assignment Score (Average score in assignment (text/file) learning activities)
- Exam attempts (Number of exams taken or re-taken)
- Assignments submitted (Number of assignments (text/file) submitted or resubmitted)
CERTIFICATIONS
While we are not relying on this system to provide any official certificates to students - it can issue completion statements/certificates. At this point we have not enabled this feature but if we do in future these metrics will be available:
- Average certification score (Average score in certificate learning activities)
- Certificate attempts (Number of certificate questionnaires (text/file) tries.)
- Certificates issued (Number of certificates issued (exam was required))
- Certificates of completion issued (Number of certificates of completion)
SOCIAL
- Posts (Number of posts in the course discussion)
- Likes on posts (Number of likes in the course discussion)
- Comments on posts (Number of comments in the course discussion)
This feature provides insight into how the content is being consumed by the users, per section, per learning activity, etc. You can gain input about how each activity performs in regards to popularity and completion.
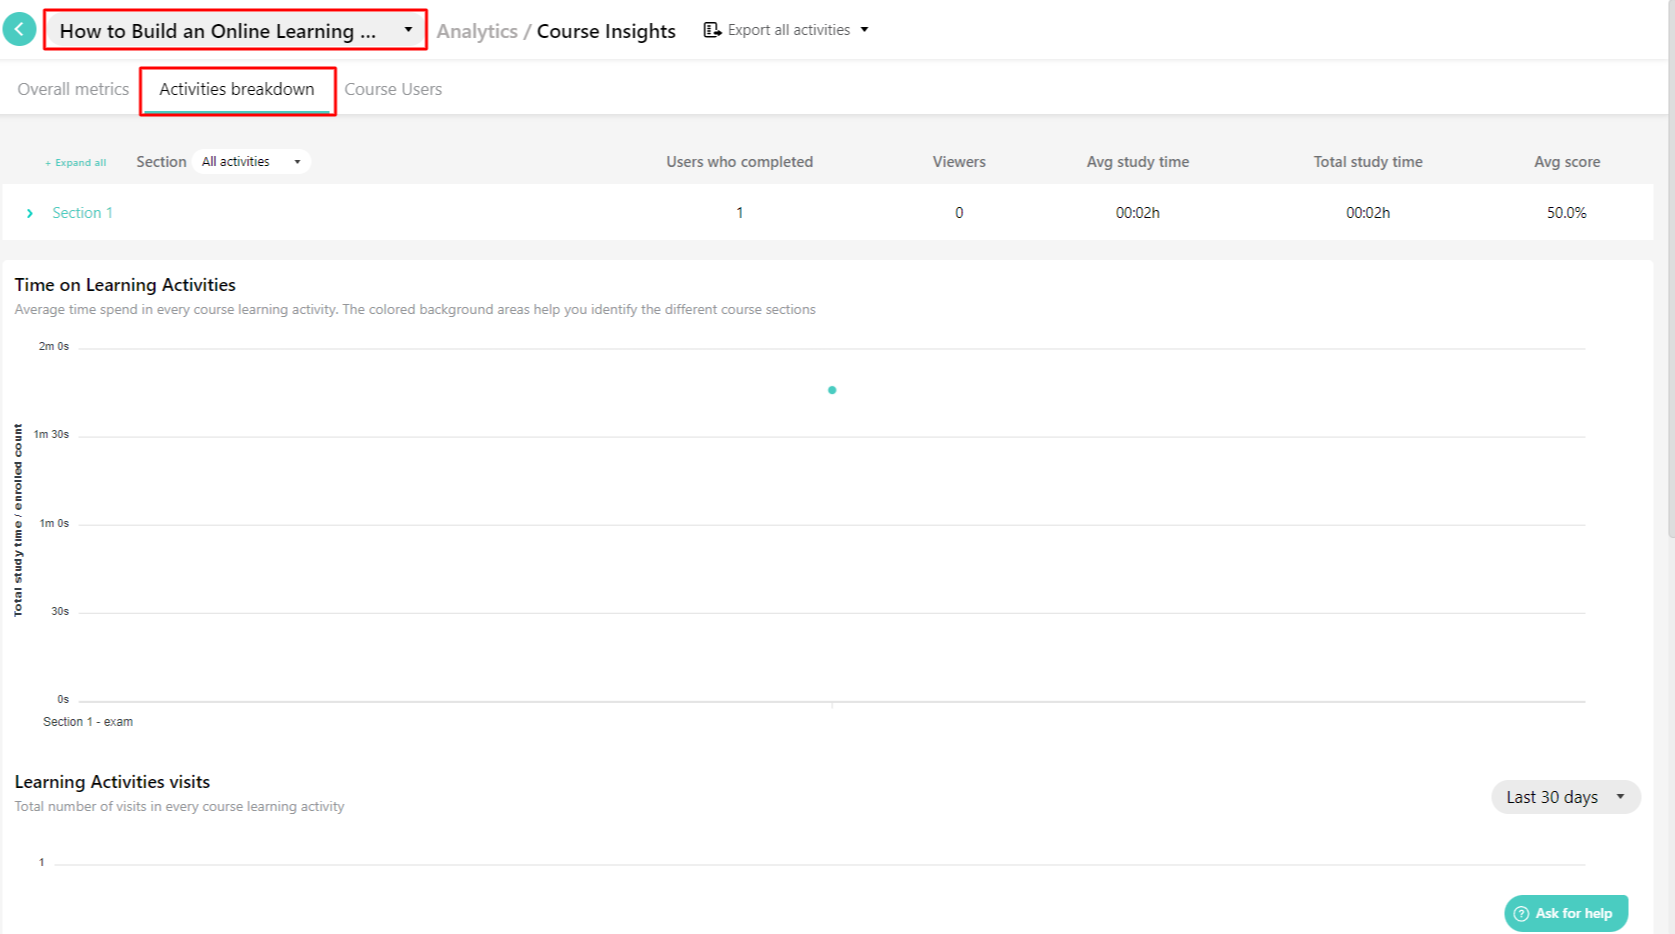
At the top, you can see a high-level overview of the user engagement statistics for your course.
The metrics available are:
- Users who completed (all activities of the section)
- Viewers (that viewed but not necessarily completed all activities)
- Average study time
- Total study time
- Average score
Left of the section name, click on the drop-down arrow for expanding it and displaying the learning activities that comprise the section. The respective metrics are now shown for each activity:
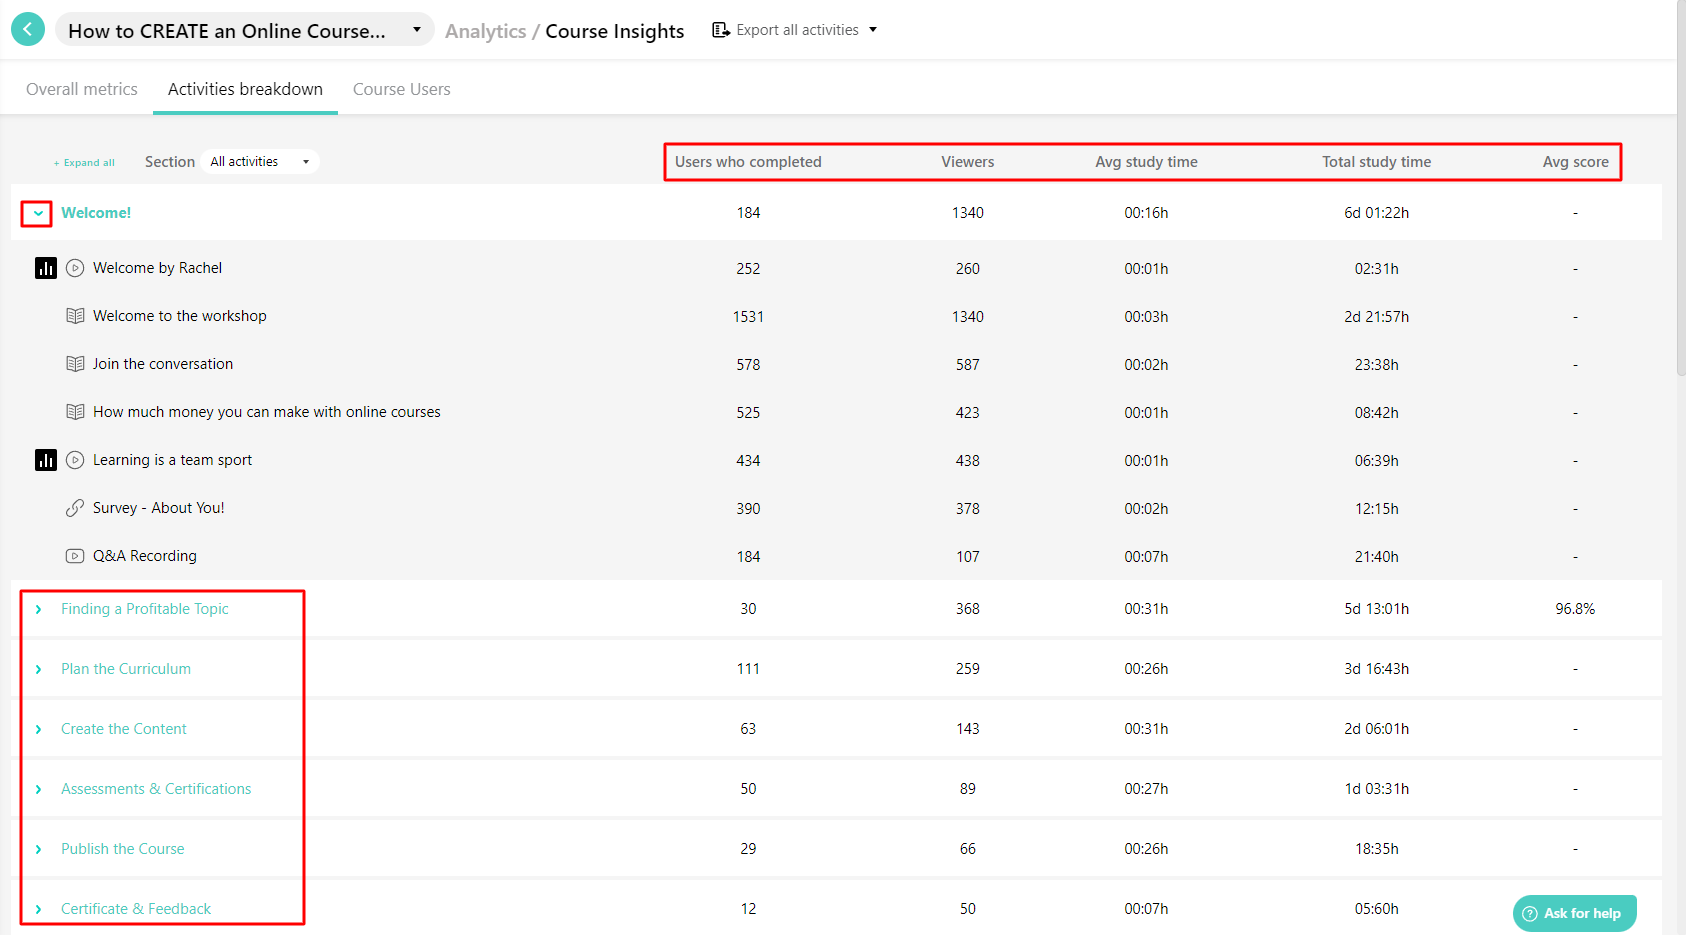
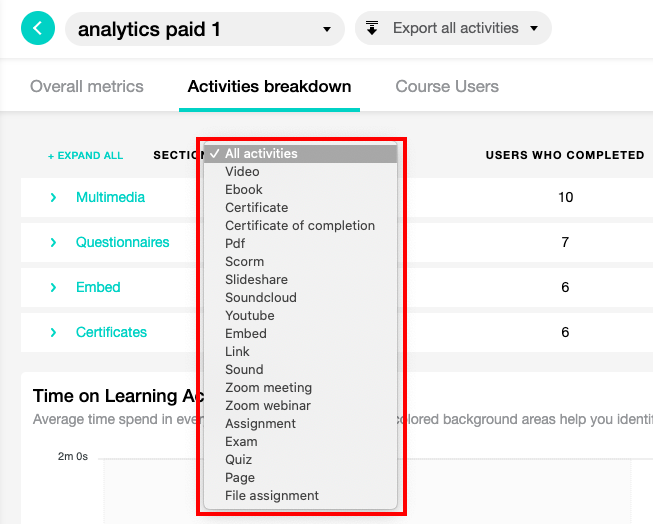
You can also select only the exact activity type you wish to be displayed from the drop-down filter list:
There are three available graphs that indicate the level of user participation throughout the course cycle:
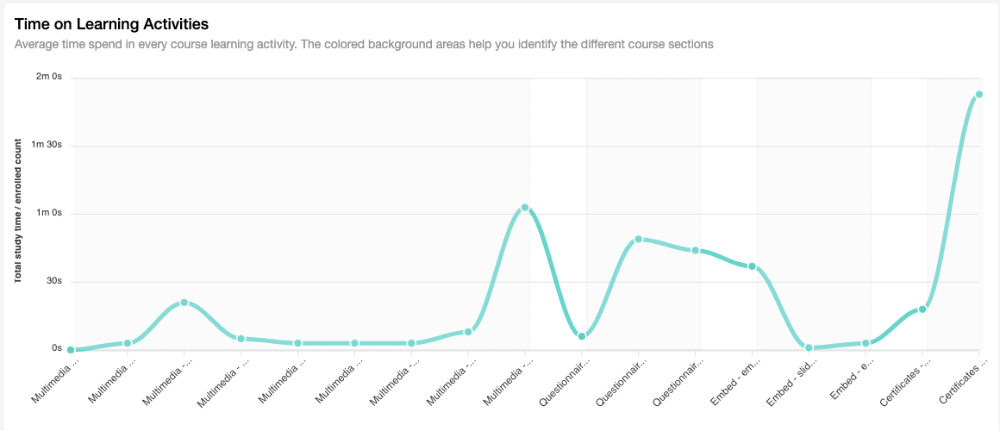
- Time on Learning Activities
- Learning Activities visits
- Learning Activities unique views
- Time on Learning Activities:
- The average study time of users per unit (total study time / enrolled users count)
Many of the graphs allow you to amend the period of analysis by filtering by the following available periods, for extracting the respective data.
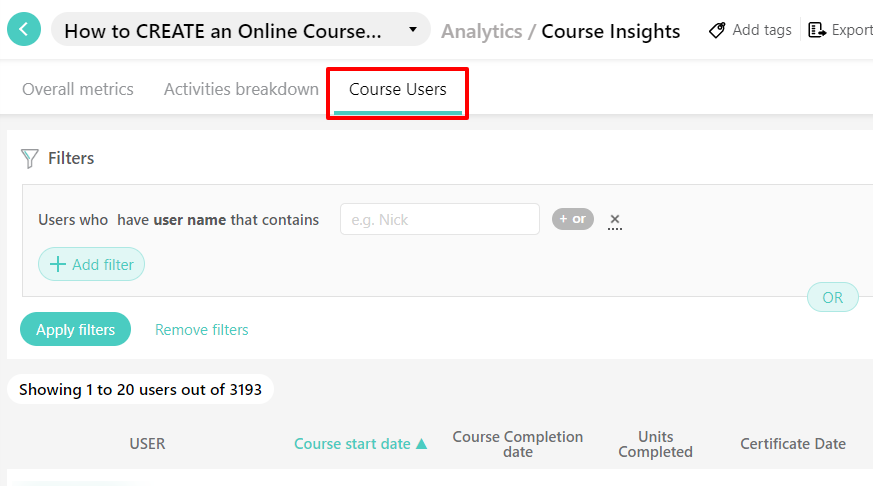
In the Course Users tab, you are able to view an in-depth analytics list for your students' engagement with the course, their Course Completion Date, Units Completed, completion Date, and Score, their Time on Video, Course, or Platform as well as their Average Course Score.
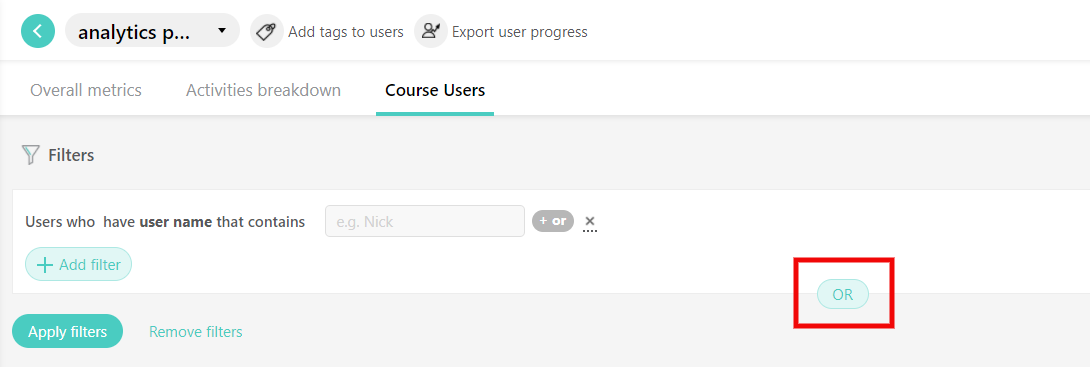
To make your search more specialised click on +Add filter to find all the available filters. The filters can be categorised into 4 areas.
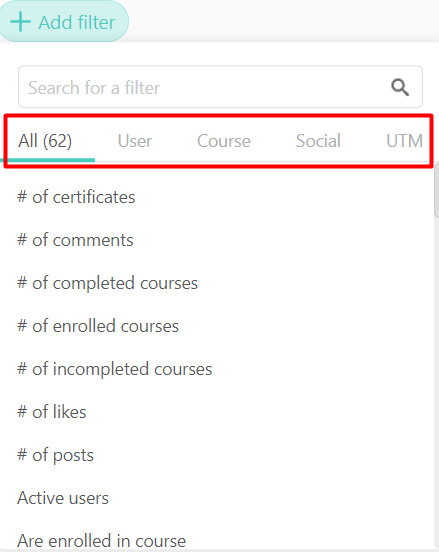
a. User: You can find any filter related to user activities, actions, or data.
b. Course: You can find any filter related to the users’ interaction with a course.
c. Social: You can find any filter related to the social activities of your users.
d. UTM - which we are not using at present.
You can combine any filter to expand your search. To do so, click on the +Add filter. You can even have a more complex search by adding an “Or” condition by clicking on the Or button. You can always remove the filters to reset your list by clicking on Remove Filters.
With the insights and tools you now have at your fingertips, you're not just teaching; you're pioneering a revolution in education. eVersity's student and course analysis tools aren't just metrics and data; they're windows into the hearts and minds of your students, allowing you to tailor your approach and make learning truly resonant.
Remember, every great educator was once a learner. The tools and tips shared are your stepping stones, ensuring that the path you carve for your students is as enlightening as the one you've walked. Embrace this opportunity to dive deep, understand better, and craft experiences that are not just educational, but transformative.
As you embark on this journey, remember that every data point tells a story, every analysis offers a lesson, and every adjustment you make has the power to light up a student's world. With the power of Learnworlds behind you, you're not just teaching content; you're shaping futures.
So, gear up, dive in, and let's redefine the boundaries of what's possible in education. Your students await the magic you're about to create. Here's to new beginnings and boundless horizons!
We hope this provides the motivational boost you're looking for! Cheers!